
The idea came from recognizing that working in tech means working in a dynamic and fast-paced environment. Things are always changing and the ability to keep learning can make a difference in your career.
In fact, the Pragmatic Programmer book recommends learning at least one new language every year.
So with this in mind, I set out to answer the question of what should I learn next. And what better way than to reverse engineer the job market to see the most requested programming languages.
And so, I was ready to start building the prototype.
Building the prototype
I imagined it being a web app, so my first challenge was a technical one: (re)learning the necessary tools for web development. I chose to learn Angular and struggle with the Plotly JS documentation in order to make the frontend. As for the backend, I had to get reacquainted with ASP.NET and Azure, after a break of a few years.
But the more interesting challenge came from a design and data visualization perspective. As opposed to other tools with higher data density that also caused more noise when displaying it, I made a conscious decision to have minimal (read clear and uncluttered) presentation that would offer a fast answer, even though it meant showing less data.
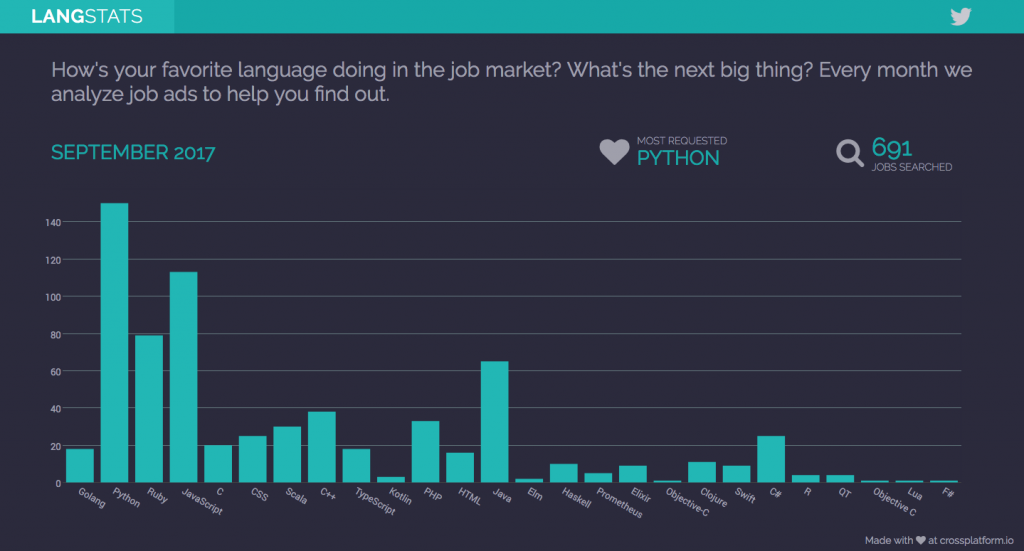
The result
Without any further ado, here’s the result – already live at langstats.azurewebsites.net. Go see it and return!
Tech stack
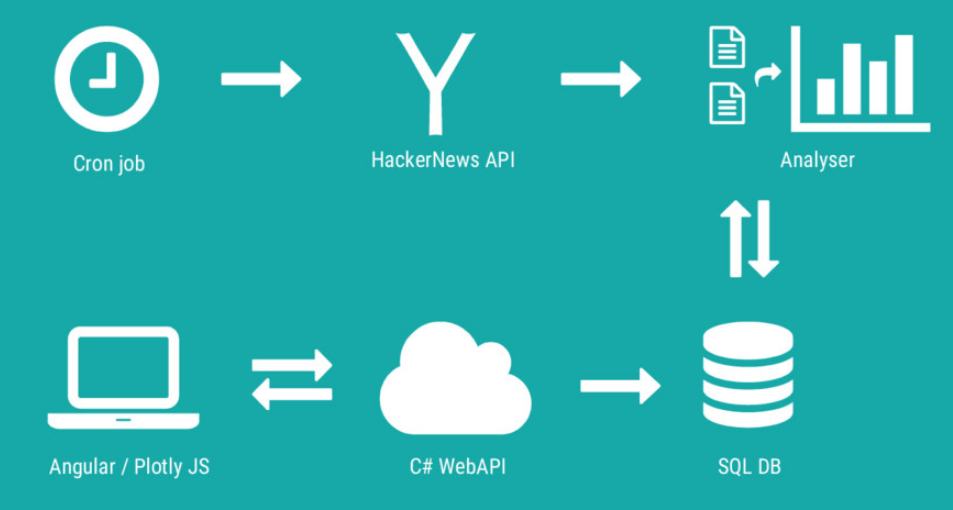
Going a bit into the technical details, the prototype ended up being a web app living in the cloud. The frontend is written in Angular and PlotlyJS and the backend is a cross-platform C# web API uploaded in Azure. The app data is stored in an Azure SQL database and synced via an Azure web job.
A cron job runs once per month, polling the HackerNews API for all the jobs posted in the previous month. It then feeds them to an analyzer which labels the with the correct keywords and stores the results in the database. From the website end, Angular makes a request to the C# backend which reads the stats from the database and returns the results to be displayed by PlotlyJS.
What did I learn?
Start small. I had a huge list of features I wanted to do, but I decided against it. Instead I went for building the minimal core feature and validating the idea. Any changes I’ll add will happen in small increments.
Don’t use beta versions of your tools. I got bitten by (1) trying to use .NET Core before it was ready and (2) uploading it to Azure and hoping that they playing along, since they’re closely related (they didn’t like each other at all). Also stumbled upon a weird Entity Framework cross-platform bug, which was quite unexpected since I’m always assuming that any bugs would come from my code only.
Carefully choose your data source, because it will impact your results. I get my data from the HN API, so the extracted trends will hold (mostly) for startups and developed countries.
Mind your external dependencies. Some months, the thread is posted later than expected, so the last lesson would be to have fail-safe mechanism whenever dealing with external dependencies.
The future
Already have a list of planned features including extending the visuals to frameworks, showing a particular’s language evolution over time, making comparisons, etc. I’m most excited about trying to make predictions about what’s going to be popular next month or next year.
But for now, I’m still gathering feedback. Have a feature you’d like to see? Tell me! Also sharing it with friends in need of guidance choosing a tech stack would be highly appreciated.
Thanks for reading!